
A data scientist is a person who turns raw data into answers a business can act on. Using math, coding, and machine learning, they explain what happened, predict what is likely to happen next, and recommend what to do about it.
It is also one of the best paid jobs in tech. The typical salary in the United States is $120,230 a year, according to the US Bureau of Labor Statistics, and employers are still hiring fast. No wonder so many students and career switchers want in.
This guide keeps things simple. You will see what the job looks like on a normal day, the skills and tools it really takes, honest US salary and job outlook numbers, how this role differs from a data analyst or a data engineer, and the exact steps to become one.
What Is a Data Scientist, in Plain English?
Think of a large company as a ship that produces data from every direction: sales records, app clicks, support tickets, sensor readings, and more. On its own, that data is just noise. That is where this role comes in: studying the noise, finding the real signal inside it, and telling the captain which way to steer.
The wider field is called data science. If you want the formal background, Wikipedia’s overview of data science covers its history and methods in depth. In short, the field mixes three things: math and statistics, computer programming, and knowledge of the business the data comes from.
IBM describes the role in a similar way: someone who combines math, programming skills, and subject knowledge to extract meaning from data and solve real problems. Miss any one of those three pieces, and the job gets much harder.
What Does a Data Scientist Do All Day?
Forget the movie version. Nobody spends all day staring at glowing charts and shouting answers. A normal week looks more like this:
- Start with a question. A manager asks something real, like “Why did sales drop in Texas last month?” or “Which customers are about to cancel?” The first job is to turn that fuzzy question into something data can actually answer.
- Find the data and clean it. This is the biggest slice of the work, and the least glamorous. Data arrives messy: missing values, duplicate rows, dates in three formats. Hours go into fixing it before any smart analysis can start.
- Explore and look for patterns. Next comes honest detective work: charts, averages, and comparisons that show what is really going on and what is just random noise.
- Build and test a model. When the question is about the future, they train a model using machine learning algorithms, the step by step methods computers use to learn from examples. The trained result, one of many possible machine learning models, then makes predictions on new data.
- Explain the result in plain words. The week usually ends in a meeting, not in code. Findings get presented as simple charts and a clear recommendation, because a result nobody understands changes nothing.
Where do they work? Almost everywhere data piles up: tech companies, banks, hospitals, insurance firms, online stores, airlines, and even professional sports teams. The data changes, but the core loop of question, clean, explore, model, explain stays the same.
Here is that loop in real life. An online store notices that repeat buyers are dropping. First, the question gets sharpened: is the drop in one product line, one city, or everywhere? Next, sales and website data gets pulled and cleaned, because half the product names turn out to be spelled two ways. Exploring the clean data shows the drop started the same week a popular item went out of stock. A simple model then flags which products are likely to run out next month, and the buying team gets a short, clear report with a fix it can act on. No magic, just careful steps in the right order.

Data Scientist Skills: What You Actually Need
These skills fall into two groups: hard skills you can study, and people skills that are easy to ignore and costly to miss. Job listings stress the first group. Promotions usually depend on the second.
Hard Skills
- Math and statistics. You do not need to be a math genius, but you do need solid basics: averages, probability, and how to tell a real pattern from a lucky streak. Statistics is the grammar of this whole field.
- Programming, mainly Python. Python is the standard language for data work. You will use it to clean data, run analysis, and build models. R is a second option, common in research and health care.
- SQL. Most company data lives in databases, and SQL is how you pull it out. It is often the very first skill tested in interviews.
- Machine learning. You should know the main methods, when each one helps, and how to check if a model is actually any good. Some roles go deeper into areas like natural language processing, where computers learn to work with human language.
- Data visualization. Charts are how your work gets believed. A clear graph in Tableau, Power BI, or a Python library can do more than ten pages of numbers.
People Skills
- Communication. You will explain technical results to people who do not code. If you can make a hard idea sound simple, you are already ahead of most applicants.
- Business sense. Companies do not pay for interesting charts. They pay for better decisions. Knowing which questions are worth money is a skill in itself.
- Curiosity and patience. Real data fights back. The job means testing ideas that turn out wrong, then trying again without losing interest.
- Storytelling. Every project ends as a story: here was the problem, here is what the data says, here is what we should do. People who tell that story well get their ideas used.

The Everyday Toolkit
The good news for your budget: most of these tools are free to learn. The typical desk setup looks like this:
- Python with pandas and scikit-learn. Pandas handles the cleaning and table work. Scikit-learn is the go to library for classic machine learning models.
- Jupyter notebooks. A notebook mixes code, results, and notes on one page, which makes experiments easy to follow and share.
- SQL and a database. Tools like PostgreSQL or a company data warehouse hold the data you query all day.
- Tableau or Power BI. Drag and drop dashboard tools for building charts that managers actually look at.
- Git and GitHub. Version control, so your code is backed up and your team can work on the same project without chaos.
- A cloud platform. Bigger jobs run on services like AWS, Google Cloud, or Microsoft Azure instead of a laptop.
Do not try to learn all of these at once. Python, SQL, and one chart tool will carry you through your first projects and most interviews.
Data Scientist Salary and Job Outlook in the US
Let us talk about money, using the most trusted source available: the US Bureau of Labor Statistics (BLS), the government agency that tracks American jobs.
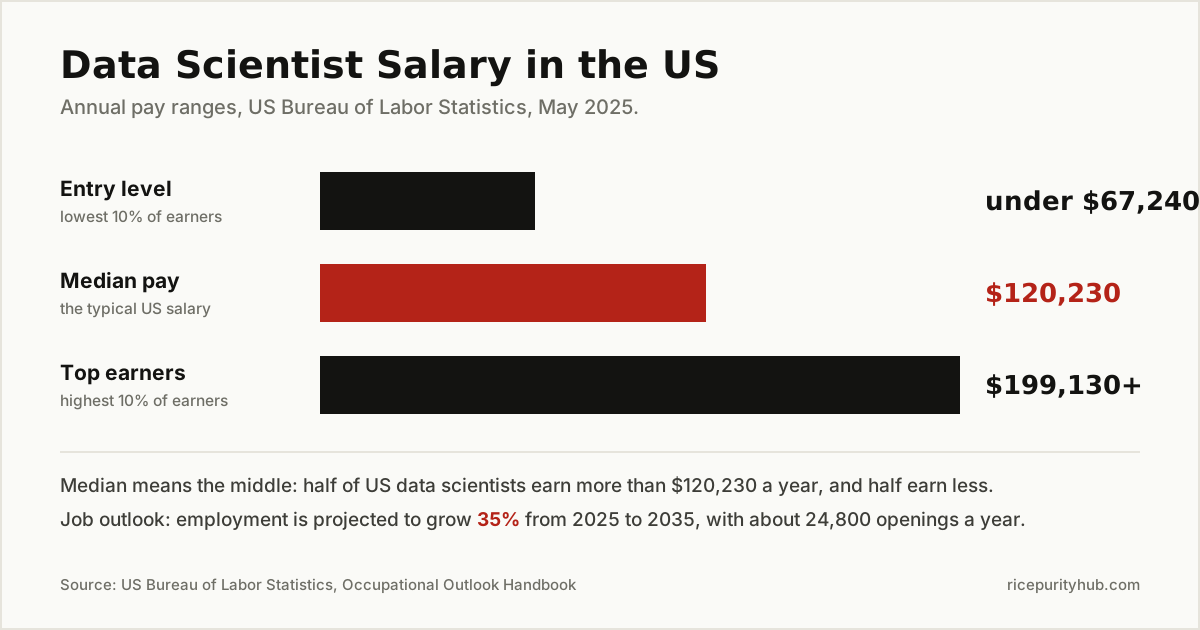
- Median pay: $120,230 per year (May 2025). Median means the middle: half earn more than this amount, and half earn less.
- Starting out: the lowest paid 10 percent earned under $67,240, which is a realistic picture of entry level pay.
- Top of the field: the highest paid 10 percent earned more than $199,130. Senior roles at large tech companies sit in this range.
- Best paying industries: publishing and content providers paid a median of $142,240, and computer systems design paid $132,380. Insurance, at $108,650, paid less than the national median.
What moves pay up or down? Experience is the biggest lever: senior staff who lead projects and review the work of others earn far more than new hires. Location matters too, with large coastal tech hubs paying the most, partly because living there costs more. A few skills carry a premium, especially deep experience with AI systems and the ability to present findings to executives. A master’s degree can also help at research heavy employers, though it is not required for most applied roles.
The outlook is just as strong. The BLS projects employment for this occupation to grow 35 percent from 2025 to 2035, much faster than the average job, with about 24,800 openings every year. Two forces drive that growth: companies collect more data every year, and they keep adding AI systems that need trained humans to build, check, and explain them.
That AI wave is also creating specialty roles. One example is the generative AI data scientist, a newer job focused on language models and AI products. The titles keep evolving, but the core skills stay the same.
One honest warning: high pay and fast growth also mean heavy competition, especially for first jobs in big cities. The salary is real, but so is the line of applicants.
Data Scientist vs Data Analyst vs Data Engineer
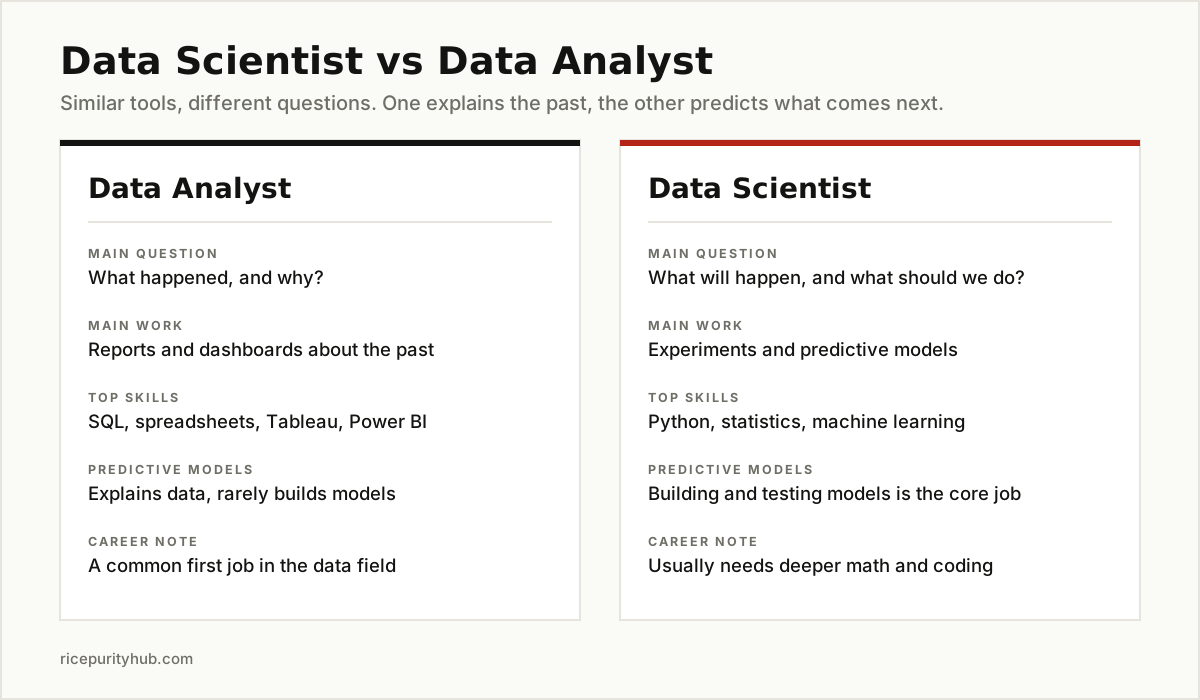
These three job titles get mixed up constantly, sometimes even inside the same company. Here is the simple split:
| Data Analyst | Data Scientist | Data Engineer | |
|---|---|---|---|
| Main question | What happened, and why? | What will happen, and what should we do? | How do we store and move all this data? |
| Main work | Reports, dashboards, charts | Experiments and predictive models | Pipelines and databases |
| Top skills | SQL, spreadsheets, Tableau | Python, statistics, machine learning | Python, SQL, cloud systems, Spark |
| Coding level | Light to moderate | Heavy | Heavy, software engineering style |
| Typical path in | First job in data | After deeper math and coding study | From software development |
A quick way to remember it: the engineer builds the roads, the analyst reads the traffic reports, and the scientist predicts where the traffic jam will happen tomorrow and how to prevent it.
Many people start as an analyst, learn more math and machine learning on the side, and then move into a scientist role. It is one of the most common and sensible paths into this career.

How to Become a Data Scientist, Step by Step
There is no single door into this job, but there is a proven order. Skipping the early steps is the mistake we see most often.
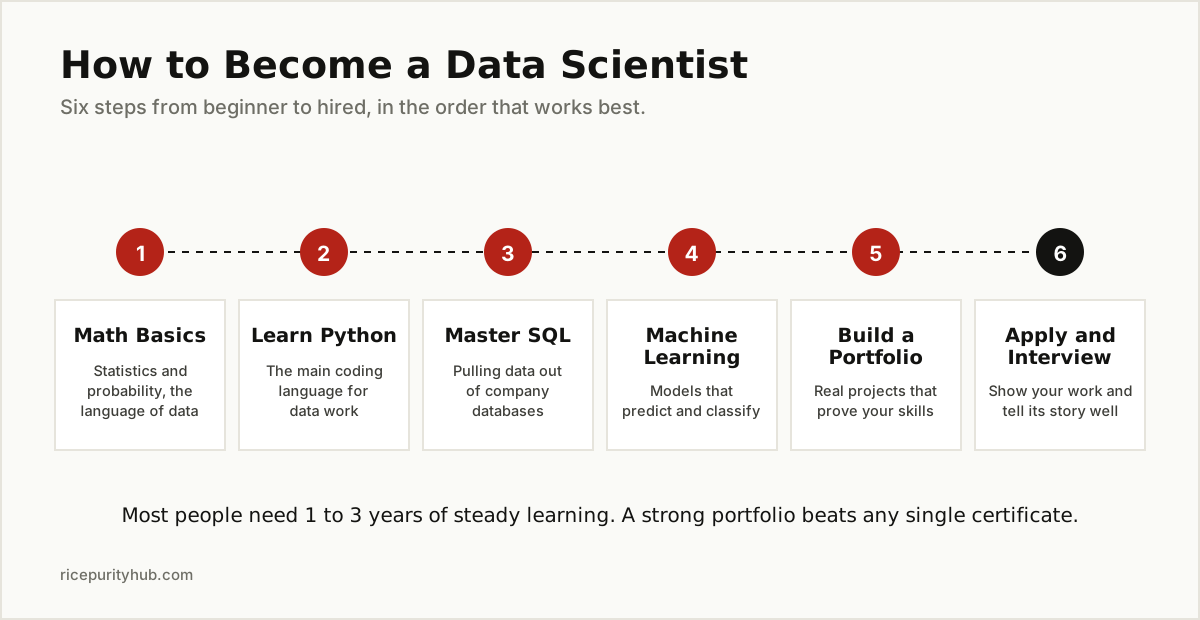
- Build your math basics. Start with statistics and probability: averages, distributions, and how likely events are. A few months of steady study here makes everything after it easier.
- Learn Python. Work through the basics, then the data tools: pandas for tables and a plotting library for charts. Write code every week, not just during courses.
- Learn SQL. Practice pulling real answers out of sample databases. Interviewers love SQL tests because the skill is used daily.
- Study machine learning. Learn the main methods, what each one is for, and how to test a model honestly. Our plain English guide to machine learning algorithms, linked earlier in this article, is a good map of the territory.
- Build a portfolio of projects. Finish three or four end to end projects with real data: a prediction, a dashboard, a clear write up of what you found. Put them on GitHub. This portfolio is your proof when you have no job experience yet.
- Get any data job you can. An analyst role, an internship, or freelance work all count. Real business data is messier than course data, and employers know it.
- Apply, interview, and keep learning. Expect technical tests and case questions. Every interview teaches you what to study next. The field moves fast, so the learning never fully stops.
What about a degree? The BLS says the typical entry level education is a bachelor’s degree in math, statistics, computer science, or a related field, and some employers prefer a master’s. A degree helps a lot, especially early. But a strong project portfolio can still get career switchers interviews, particularly for applied business roles.
Who Should Skip This Career
Honest advice matters more than hype, so here is the other side. This job is probably not for you if:
- You dislike math. You do not need to love it, but statistics shows up every week. Fighting it forever will make you miserable.
- You want the same day twice. Projects change constantly, questions change weekly, and tools change yearly. Some people thrive on that. Others hate it.
- You hate explaining your work. Half the value of this job is communication. If presenting results sounds awful, the role will frustrate you.
- You are chasing the salary only. The entry level market is crowded now. People who also enjoy the puzzle of data last longer and earn more in the end.
- You expect clean data and clear answers. Real projects are messy, deadlines are real, and sometimes the honest answer is “the data cannot tell us that.”
None of this means the field is closed. It means you should walk in with open eyes, because the people who do tend to stay and do well.
The Bottom Line
A data scientist turns messy data into decisions: asking sharp questions, cleaning and exploring data, building models that predict, and explaining the results so a business can act. The pay is strong, the US job outlook is among the fastest growing in the country, and the path in is clear, even if it takes real work.
Start with math basics, Python, and SQL. Build projects. Show your work. That simple formula, repeated patiently, is how most people working in this field actually got hired.
Want to keep going? Browse our full AI, ML and Data Science guides for plain English explainers on the algorithms, models, and tools behind this career.