Every store manager knows two bad feelings. The first is watching a customer walk away because a popular product is out of stock. The second is staring at a warehouse shelf full of items nobody wants to buy. Predictive analytics in supply chain work exists to prevent both of those moments.
In plain words, predictive analytics means using past data to make smart guesses about the future. Instead of reacting after a problem shows up, a business studies its history, spots patterns, and acts early. Used well, it turns ordering, stocking and shipping from guesswork into a calm, planned routine.
This guide explains what it is, how it works, and where it helps most. You will see the main use cases, the real benefits, a step by step example, and the honest challenges. You will also find simple first steps that a small business can take without a big budget.
What Is Predictive Analytics in the Supply Chain?
A supply chain is the full path a product travels, from raw materials and factories to warehouses, trucks, store shelves and finally the customer. Predictive analytics is the part that looks ahead along that path.
When people talk about predictive analytics in supply chain, they usually mean software that studies old records and predicts things like future demand, delivery delays or stock shortages. As IBM explains in its guide to predictive analytics, the field uses statistics and modeling to find patterns in data and estimate what is likely to happen next.
The predictions usually come from machine learning models that were trained on months or years of company history. Those models are built with machine learning algorithms that learn from examples, much like a person learns from experience. The more good history the model sees, the sharper its guesses become.
One thing is worth saying early. A forecast is a smart guess, not a promise. Good teams treat predictions as strong advice, then apply their own judgment before spending money.
How It Works: From Data to Decisions
The process has four simple steps, and they repeat in a loop.
Step 1: Collect the data. The business gathers past sales, orders, stock levels, delivery times and return records. Many teams also add outside signals, such as weather forecasts, holidays and local events, because all of these change buying habits.
Step 2: Build the model. Software studies the data and learns the patterns hiding inside it. For example, it may learn that soup sales rise when the temperature drops, or that one supplier is often late in December.
Step 3: Make the forecast. The model produces clear predictions. It might say that a store will likely sell a certain number of jackets next month, or that a delivery route will run into heavy traffic on Friday.
Step 4: Act on it. People review the forecast and make decisions. They order stock, adjust delivery plans, or call a backup supplier. Then real results come in, the data set grows, and the next forecast gets a little smarter.
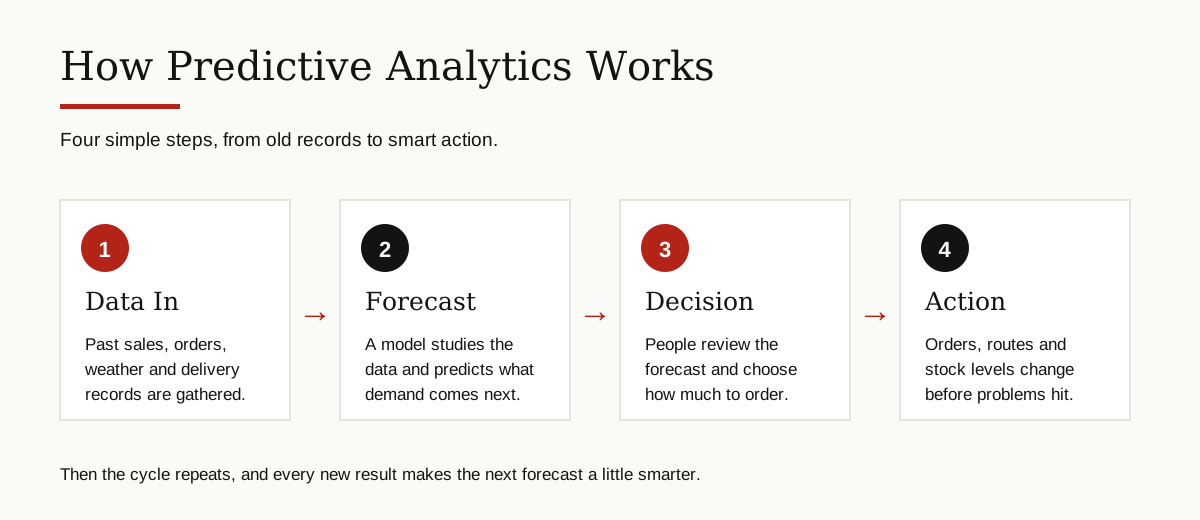
That loop, data in and action out, is the heart of the whole approach. Nothing about it is magic. It is careful record keeping, plus math that never gets tired of looking for patterns.
The Main Use Cases
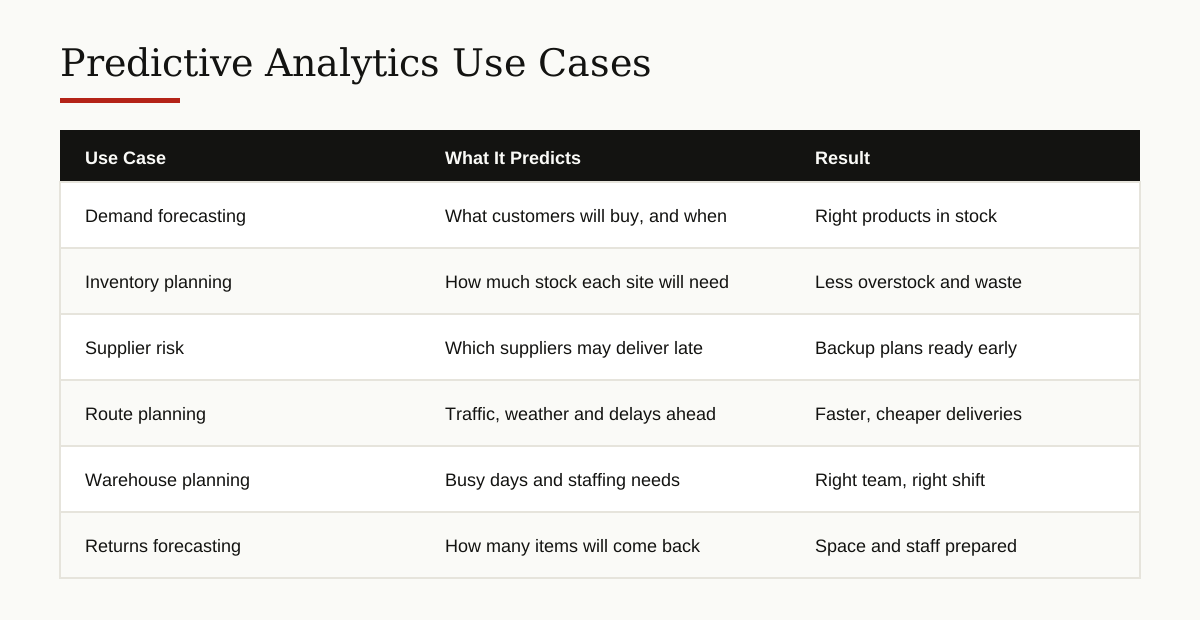
Here is where predictive analytics in supply chain teams earn their keep, day after day.
Demand Forecasting
Demand forecasting is the most common use of all. The software predicts what customers will buy, in which store or region, and in which week. Good demand forecasts drive almost every other decision, because ordering, staffing and shipping all depend on expected sales.
Inventory Planning
Inventory planning decides how much stock each location should hold. Too much stock locks up cash and fills shelves with items that may never sell. Too little stock means empty shelves and lost sales. Finding the middle ground is where good forecasting earns its keep, and it is where many businesses save the most money.
Supplier Risk
Suppliers have bad weeks too. A forecast can flag which suppliers are likely to deliver late, based on their past record, order size and even conditions in their region. With an early warning, a business can order sooner, split the order, or line up a backup supplier before a delay hurts customers.

Delivery Route Planning
Trucks lose time and fuel when routes ignore traffic, road work and weather. This is where predictive analytics in logistics industry settings shines, because delivery fleets generate huge amounts of route and timing data. Research groups such as the MIT Center for Transportation and Logistics study exactly these problems, and their work shapes how modern fleets plan routes that change with real conditions.
Warehouse Planning
Warehouses have busy days and quiet days. Forecasts predict the busy ones in advance, so managers can schedule the right number of workers, prepare packing stations and avoid a backlog of orders waiting to ship.
Returns
Online shopping produces a steady stream of returned items. Predicting return volume helps a business prepare space, staff and inspection steps for the items coming back, instead of being surprised by them.
To sum up the use cases, here is a quick comparison of working with and without forecasting:
| Area | Without Forecasting | With Forecasting |
|---|---|---|
| Demand | Guesswork and gut feel | Plans based on data |
| Inventory | Too much or too little stock | Stock matched to likely demand |
| Delivery | The same fixed routes every day | Routes adjusted for traffic and weather |
| Suppliers | Surprises when a delivery is late | Early warnings and backup plans |
The Key Benefits
The benefits of supply chain analytics show up in four places that any business owner can understand.
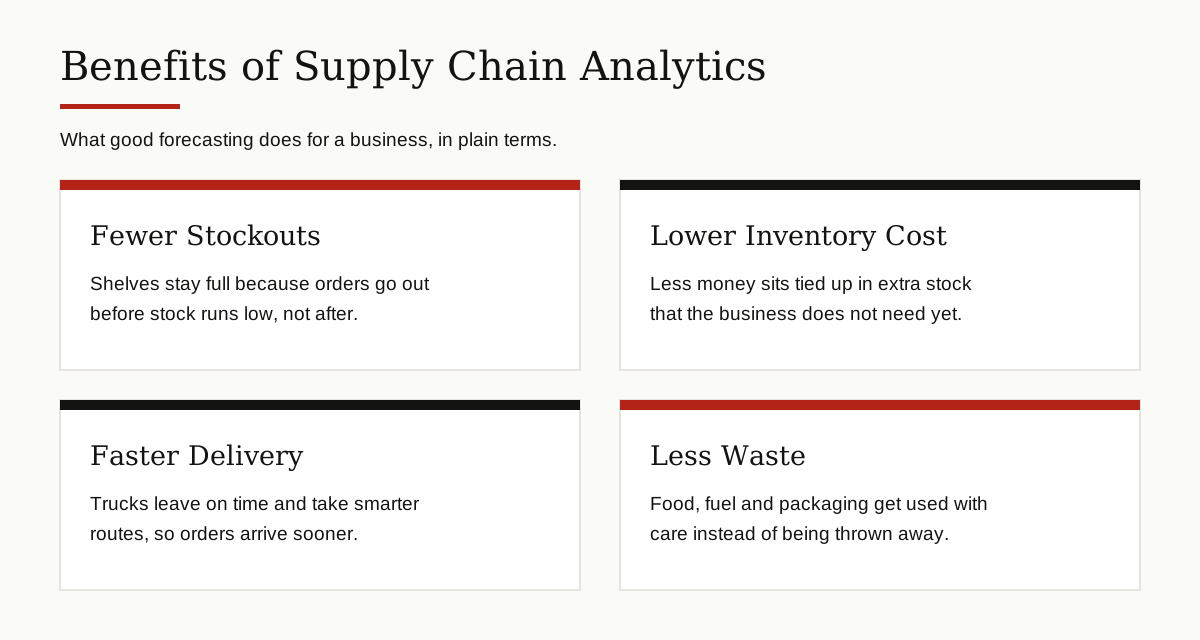
Fewer stockouts. When orders go out before stock runs low, shelves stay full and customers find what they came for. Every avoided stockout is a sale that would otherwise be lost.
Lower inventory cost. Money tied up in extra stock is money that cannot be spent anywhere else. Better forecasts mean a business buys closer to what it will actually sell, so less cash sits sleeping on warehouse shelves.
Faster delivery. Smarter routes and earlier planning mean trucks leave on time and take better paths. Customers get their orders sooner, and the business burns less fuel doing it.
Less waste. Food spoils, fashion goes out of style, and packaging gets thrown away. Ordering closer to real demand cuts all of that waste down.
For many companies, predictive analytics in supply chain programs pay for themselves through fewer rush orders, less wasted stock and happier customers who come back. The methods behind all of this sit inside the wider field of predictive analytics, which also powers things like credit scoring and storm warnings.
A Worked Example: A Clothing Store Prepares for Winter
To see how this works in practice, imagine a small clothing retailer with three stores. This is an example, but every step follows the same pattern real businesses use.
Step 1: Gather last year’s data. In September, the owner pulls up last winter’s sales. Heavy coats sold out by mid December, while a large order of light jackets barely moved. Delivery records show the main coat supplier was two weeks late in November.
Step 2: Add outside signals. The owner checks the seasonal outlook, which points to a cold winter, and notes the dates of local holiday events that usually lift store traffic.
Step 3: Make a simple forecast. Using the sales history and the cold outlook, the owner estimates coat demand for each store, week by week, for November through January. The estimate for light jackets stays low on purpose.
Step 4: Act early. Coat orders go out in early October, split between the main supplier and a backup, because the records warned about late delivery. Light jacket orders stay small. Extra staff shifts are planned for the two busiest forecast weeks.
Step 5: Compare and learn. When winter ends, the owner compares the forecast with what really sold. The notes from that comparison become the starting data for next year’s plan.
This is the same thinking at a small scale. The tools were simple, but the pattern, history first, forecast second, action third, is exactly the same one giant retailers follow.

Challenges to Expect
Honest guides should name the hard parts too. Three challenges show up again and again.
Bad data. If sales records are messy, with missing weeks or wrong numbers, the forecast built on them will be shaky. There is an old saying in data work: garbage in, garbage out. Cleaning the data is boring, but it is the most important step of all.
Cost. Serious software, sensors and skilled staff cost money. The good news is that a business does not have to buy everything at once. Starting small, with one product line or one store, keeps the cost under control.
Change. People who have ordered stock by gut feel for years may not trust a forecast at first. The fix is patience. Start with small decisions, show the results, and let trust grow from real wins.
None of these problems has to kill a project like this, but each one can slow it down. Knowing them in advance makes the whole effort smoother.
Tools and First Steps for a Small Business
A small business does not need a huge budget to start with the basics. Here is a sensible path.
- Start with your own sales history. Export last year’s sales into a spreadsheet. Look for patterns by month, season and promotion. Even this simple step surprises many owners.
- Clean the data. Fix gaps, remove duplicate orders and make sure product names are consistent. A forecast is only as good as the records under it.
- Pick one problem. Choose a single pain point, such as one product that always sells out, and forecast only that. One clear win builds confidence for bigger steps.
- Use the forecast tools you already have. Many inventory and accounting tools include basic forecasting features. Spreadsheet apps can also project past trends forward with a few clicks.
- Review every month. Compare each forecast with reality, write down what you learn, and adjust. The habit matters more than the software.
Bigger companies hire specialists who do this work full time. If that career path sounds interesting, our guide on what is a data scientist explains the role in plain words.
Conclusion
Predictive analytics in supply chain work is not magic, and it is not only for giant companies. It is a simple idea done with discipline: study the past, make a smart guess about the future, and act before problems arrive. Done month after month, it means fuller shelves, lower costs, faster deliveries and less waste.
If you are new to the field, start small. Clean your data, forecast one product, and learn from the result. To keep learning, explore more guides in our AI, ML and Data Science category, where we explain each topic in the same plain style.