Ask ten managers how their team is doing and you will get ten long answers. Ask for their KPIs and the answer gets short and honest, because a KPI forces a team to pick the few numbers that actually prove progress.
KPI stands for key performance indicator. This guide collects the KPI examples teams ask for most, grouped by department: sales, marketing, finance, operations, customer, and HR. Each one comes with a one-line meaning and the standard formula where one exists, so you can copy the pattern and build your own short list.
What Is a KPI?
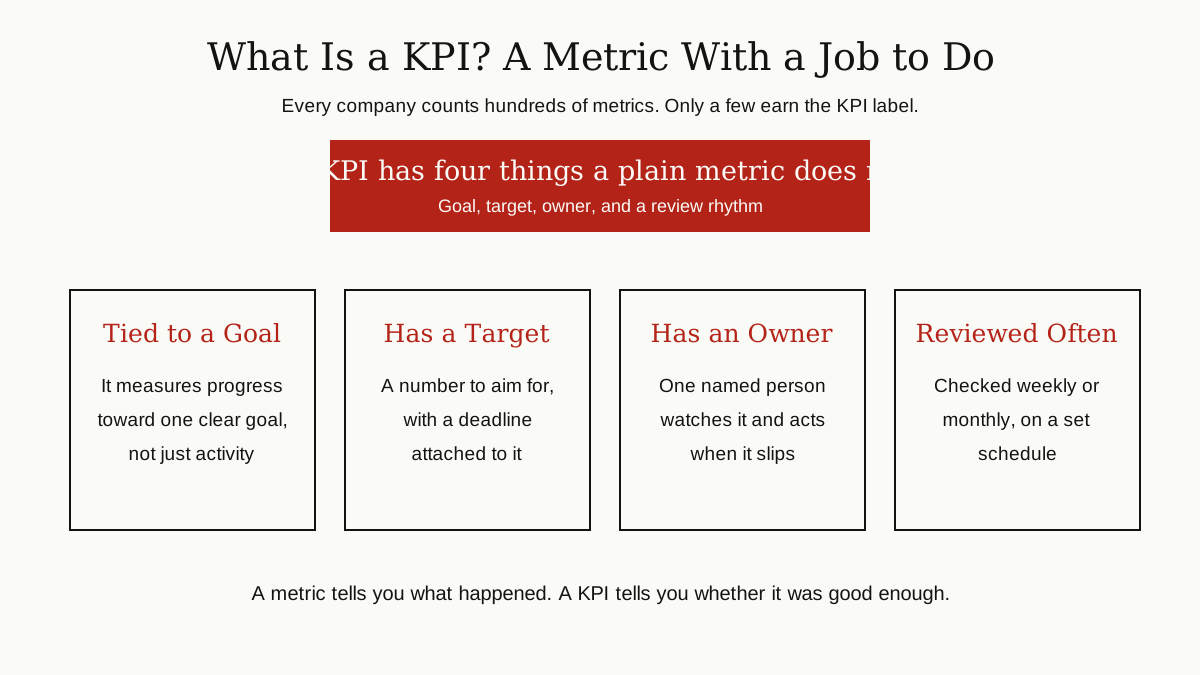
A KPI is a small set of numbers tied directly to a goal. Not every number a company counts is a KPI. Your website may record hundreds of metrics, from page views to button clicks, but only the handful that are wired to a real goal earn the KPI label.
As Klipfolio puts it, a KPI is a quantifiable measurement that tracks progress toward a specific business objective over a set period of time. The key word is objective. A metric is just a count. A KPI is a count with a purpose, a target, and someone responsible for it.
That goal has to come first. If your team cannot yet say clearly what the business offers and why customers should care, no dashboard will fix that. Our guide to the value proposition is a good place to start before picking numbers.
KPIs also live at different levels. A company-wide KPI, such as total revenue growth, tells leaders whether the whole business is healthy. Team KPIs sit one level down and track the work that feeds the big number, such as the sales team’s conversion rate or the support team’s response time. The two levels should connect: if the team numbers are improving and the company number is not, one of the two lists is measuring the wrong thing.
What Makes a Good KPI?
Good KPIs share four traits. They are tied to a goal, so everyone knows why the number matters. They can be measured with data the team actually has, not data it wishes it had. They have an owner, a named person who watches the number and acts when it slips. And they are reviewed on a rhythm, weekly, monthly, or quarterly, instead of being checked once and forgotten.
Many teams test a KPI against the SMART checklist. In simple words, that means the goal behind it is clear and specific, counted with numbers, possible to reach, connected to the real work of the team, and given a deadline. Asana says the same thing in its KPI template guide: pair each KPI with a business objective, keep the list short, and steer clear of vanity metrics.
A good KPI also needs a target with context. A number on its own says almost nothing. Revenue of a million dollars sounds strong until you learn that last year it was two million, or that the target was three. Targets usually come from one of three places: your own past results, the results of similar companies, or a goal the business has committed to. Whichever source you use, write the target down next to the KPI itself, so every review starts from the same facts.
Some KPIs are not chosen freely at all. In banking, health care, and other regulated fields, certain numbers must be watched as part of compliance monitoring, whether or not anyone finds them exciting.
Sales KPI Examples
Sales KPIs answer one question: is the selling machine bringing in more and better business over time?

Revenue growth rate. How fast sales income is growing compared with an earlier period, usually the same month or quarter last year. Formula: (Revenue this period - Revenue last period) / Revenue last period x 100.
Sales conversion rate. The share of leads that turn into paying customers. It shows whether the pipeline is full of real buyers or just names. Formula: Deals won / Total leads x 100.
Average deal size. The typical value of one closed deal. A rising deal size can mean the team is selling to bigger customers or selling more to each one. Formula: Total revenue / Number of deals closed.
Marketing KPI Examples
Marketing KPIs connect spending to results. They show what it costs to win attention, leads, and customers.

Cost per lead. What the team spends, on average, to win one new lead, meaning one person who has shown interest and left a way to reach them. Formula: Total marketing spend / Number of new leads.
Customer acquisition cost. The full cost of winning one new customer, usually counting both marketing and sales spending together. Shortened to CAC, it only makes sense next to what a customer is worth over time. Formula: Total sales and marketing costs / Number of new customers.
Website conversion rate. The share of visitors who do the one thing the page is built for, such as buying, signing up, or booking a call. Formula: Conversions / Total visitors x 100.
Finance KPI Examples
Finance KPIs watch the health of the money itself: what the business keeps from each sale, and whether it can pay its bills.
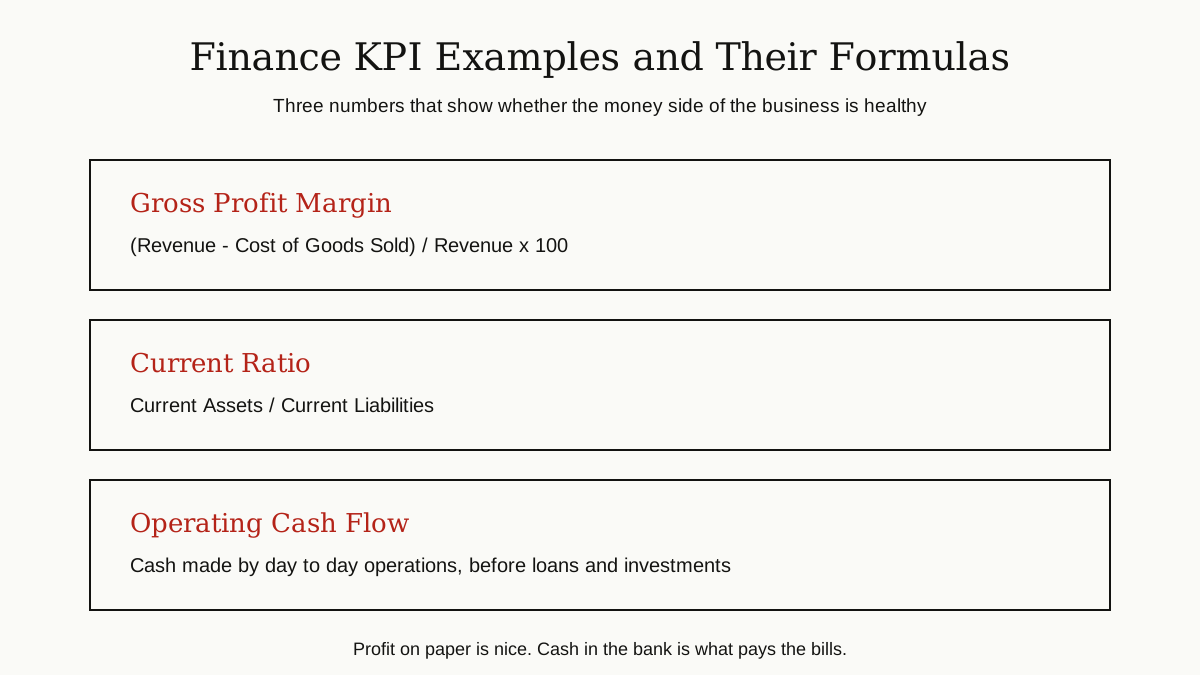
Gross profit margin. The share of each sale left after the direct cost of making or buying what was sold. It is the first test of whether prices and costs are in balance. Formula: (Revenue - Cost of goods sold) / Revenue x 100.
Operating cash flow. The cash the everyday business brings in and pays out, leaving aside loans and investments. There is no ratio here; it is read from the cash flow statement, and it answers the simplest question of all: does the core business produce cash?
Current ratio. Whether short-term assets, such as cash and stock on hand, are big enough to cover bills due within the year. A ratio below 1 means those bills are larger than the assets meant to pay them. Formula: Current assets / Current liabilities.
Operations KPI Examples
Operations KPIs measure how well the business keeps its promises: on time, without defects, and without cash sleeping on shelves.
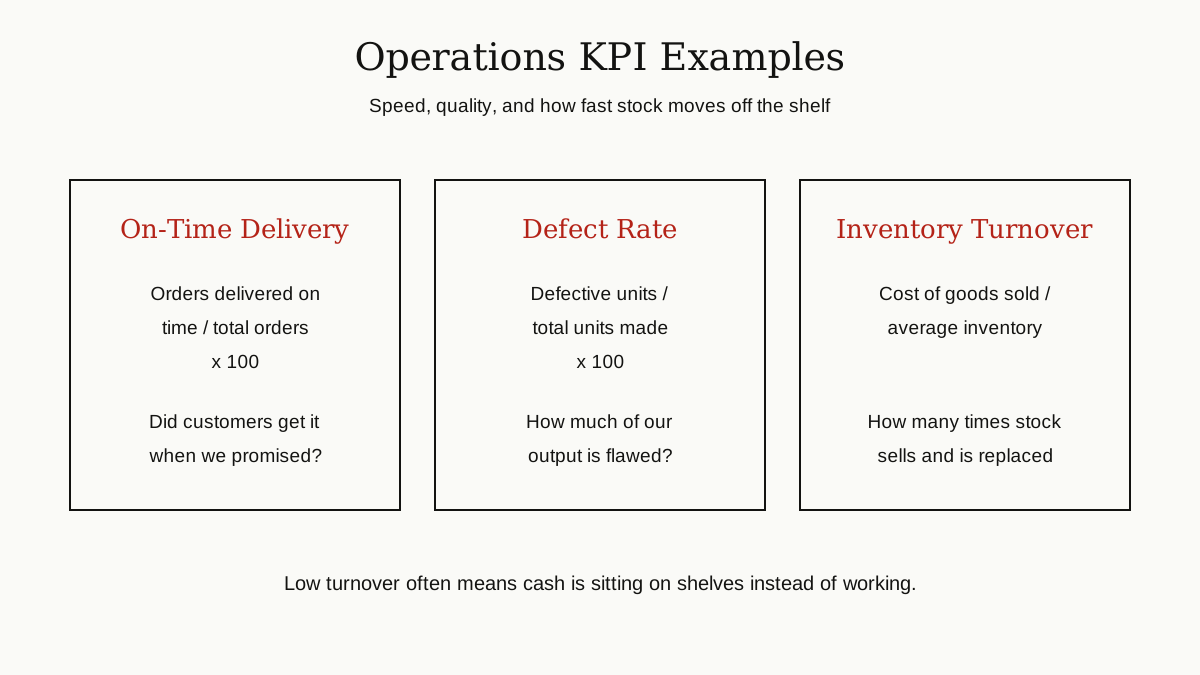
On-time delivery rate. The share of orders that arrive by the promised date. Customers forgive many things, but repeated lateness is rarely one of them. Formula: Orders delivered on time / Total orders x 100.
Defect rate. The share of output that comes out flawed and needs repair, rework, or the bin. It is the plainest picture of quality a factory or service team can get. Formula: Defective units / Total units produced x 100.
Inventory turnover. How many times stock is sold and replaced in a period. Very low turnover usually means money is sitting on shelves. Extremely high turnover can mean shelves keep running empty. Formula: Cost of goods sold / Average inventory.
Customer KPI Examples
Customer KPIs measure loyalty: do people stay, do they leave, and would they recommend you?
Customer retention rate. The share of customers who are still with you at the end of a period, not counting brand new ones. Formula: ((Customers at end of period - New customers) / Customers at start of period) x 100.
Churn rate. The share of customers who leave during a period. Retention and churn are two views of the same door, one counts who stayed and the other counts who walked out. Formula: Customers lost during period / Customers at start of period x 100.
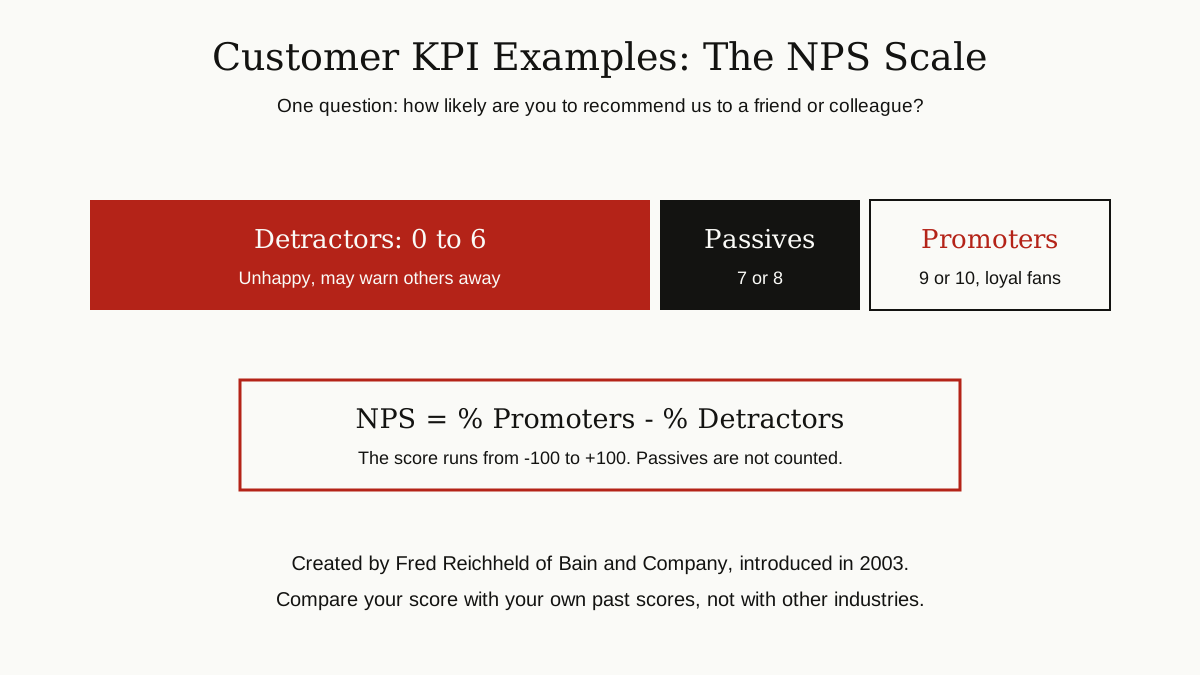
Net Promoter Score. This one comes from a single survey question: on a scale of 0 to 10, how likely are you to recommend us to a friend or colleague? People who answer 9 or 10 are promoters, happy customers who spread the word. Answers of 7 or 8 are passives, satisfied but quiet. Anyone at 6 or below is a detractor, unhappy enough to warn others away. The score is the percentage of promoters minus the percentage of detractors, so it runs from -100 to +100.
Net Promoter Score was created by Fred Reichheld of Bain and Company and introduced in his 2003 Harvard Business Review article, “The One Number You Need to Grow.” Bain later built a full management approach around it, and its Net Promoter System site stresses the follow-up: hear feedback in the customer’s own words and act on it fast. One warning: scores vary a lot from one industry to another, so judge yours against your own past scores, not against a famous company in a different business.
HR and Team KPI Examples
People KPIs help leaders see whether the team is stable, growing at a healthy pace, and actually showing up.
Employee turnover rate. The share of employees who leave in a period, including people who quit and people who are let go. Some turnover is normal and even healthy; a steady climb is a warning sign. Formula: Employees who left / Average number of employees x 100.
Time to hire. The average number of days between a candidate applying for a job and accepting an offer. A long time to hire often means good candidates take other jobs while your process is still scheduling interviews. It has no percentage formula; it is counted in days.
Absenteeism rate. The share of scheduled workdays lost to absence. Read over months, not days, it can point to burnout, illness, or a team quietly disengaging. Formula: Days absent / Total scheduled workdays x 100.
One caution with people KPIs: they describe groups, not individuals. A rising turnover rate is a signal to go and talk to the team, ask what changed, and listen. Used carelessly, as a scoreboard for naming and shaming single managers, these numbers quickly stop being honest, because people learn to hide bad news instead of reporting it.
How to Choose Your Own KPIs
Start from the goal, not from the data you happen to have. Write the goal in one sentence, then ask which number would prove it is happening. That number is your first KPI candidate.
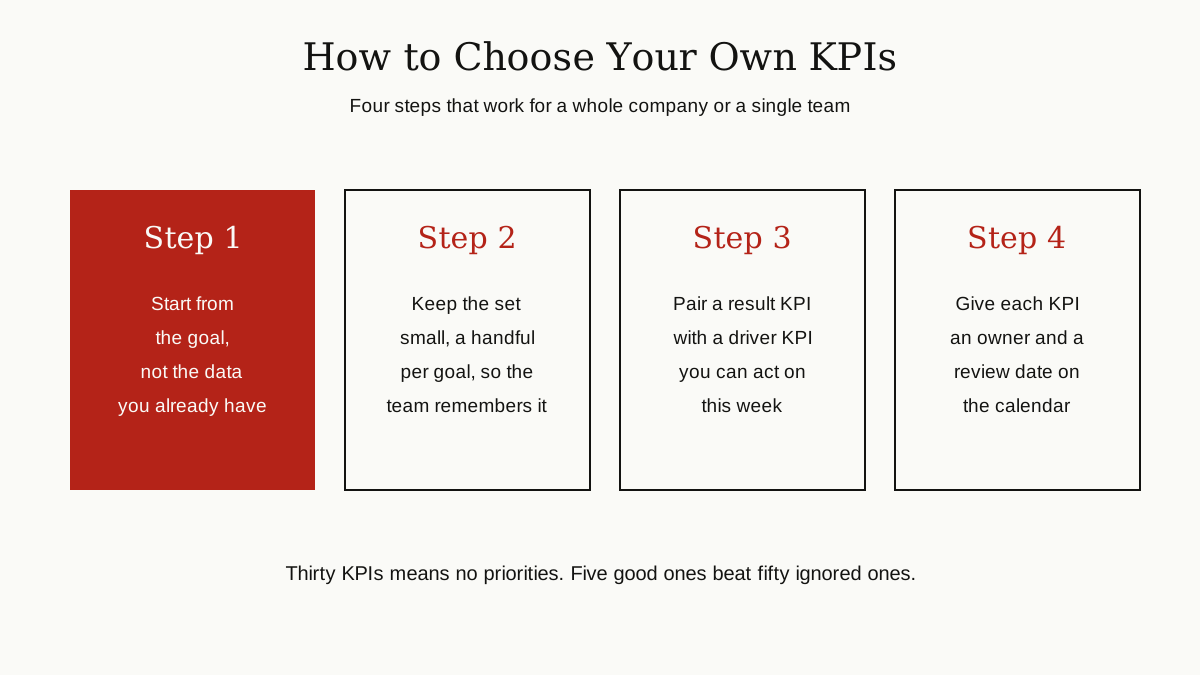
Keep the set small. When everything is a priority, nothing is. Most teams do well with a handful of KPIs per goal, few enough that everyone can recite them without opening a dashboard.
Pair a result KPI with a driver KPI. A result KPI reports the past, like revenue this quarter. A driver KPI moves earlier and can still be changed, like the number of sales calls booked this week. Results tell you the score; drivers tell you where to push. Most teams track their list where the work already lives, in a shared dashboard or inside their project management tools, and review it in the same meeting each week or month.
Finally, expect the list to change. A KPI that mattered when the company had ten customers may be useless at ten thousand. Once or twice a year, ask of every KPI on the list: if this number moved sharply next month, would we do anything different? If the answer is no, retire it and give its slot to a number the team can still act on.
Common KPI Mistakes
The most common mistake is tracking too many KPIs. A list of forty indicators is not a strategy; it is noise, and within a month nobody reads it.
Second is falling for vanity metrics, big numbers that feel good but change no decision. Total followers can climb for a year while sales fall. If a number going up would not change what anyone does on Monday morning, it is decoration, not a KPI.
Third is setting targets with no owner. A KPI nobody owns is a poster on the wall. Every KPI needs a name next to it, a target, and a review date, or it will quietly stop being measured at all.
The Bottom Line
KPIs work when they stay few, honest, and owned. Pick the numbers that prove progress toward a real goal, give each one a target and a person, and review them on a steady rhythm. Start with the examples for your own team above, cut the list down to the ones you would genuinely miss, and let the rest go back to being plain metrics.
For more guides like this one, browse the business productivity category.